Using Event Data to Chart a Path Forward
Source : PCMA
Author: Michelle Russell & Barbara Palmer

Data is not just a matter of what information you collect about your events and its participants. The most important part of the data journey is how you communicate stats and numbers to others. It’s about taking a point of view about the data and creating a compelling story to take action. Here’s how to get started.
Editor’s note: This article is part of the Convene July 2022 cover & CMP Series story package. Find links to the other stories at the bottom of this page.
Event organizers were swimming in data before the pandemic. From information collected at their in-person events through their registration systems to their mobile apps, from social-media tools to web analytics, and from RFID badges to chatbots, there were abundant opportunities for event organizers to analyze how attendees experienced their events.
But when in-person events moved online during the pandemic, the volume of data available to organizers probably jumped tenfold, estimates Joe Colangelo, founder and CEO of Arlington, Virginia–based events analytics company Bear Analytics. And interestingly, he told Convene, the fidelity or quality of that data became higher.

Joe Colangelo
Which means the stakes are higher for planners, and the pressure for them to develop data skills compared to before the pandemic has definitely increased, Colangelo said.
It’s important to remember, Colangelo said, that “data collection is not analytics. And analytics are not insights. You can have a treasure trove of data, and what typically happens with it? It gets exported into Excel, and then into charts, and maybe rolled up, like sessions attended over time, to get to answers to very specific questions. And then that’s often presented to someone else. Now that’s analytics, right? It’s not fun because it has to be done repeatedly, regularly, and probably feels like painful analytics. But it’s better than nothing, and it’s more impactful than just collection alone.”
For Colangelo, what truly “unlocks” data is going from insights to “enablement.

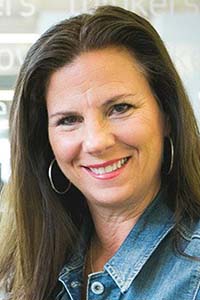
Nancy Duarte
Wrapping Data Around a Story
It’s one thing for the results to enable you to make improvements. It’s another to create a compelling case for what the data tells you what your path forward should be. “In a business world drowning in data, the most valuable employees will be the storytellers who have the skills to explain and inspire with data,” Nancy Duarte, principal of communications agency Duarte Inc., wrote in a LinkedIn post. “If you can understand data, give it meaning, and make actionable recommendations, you make yourself an invaluable asset to your workplace and industry. Data doesn’t speak for itself; it needs a storyteller.”
When you decide to say, “‘You know what, I have a point of view about what I found in the data,’” Duarte said, “that’s a real career-defining moment. That’s like moving from individual contributor to a trusted advisor” because you can recommend what action needs to be taken as a result.


